| Exam Name: | WGU Applied Algebra FXO2 PFXP C957 | ||
| Exam Code: | Applied-Algebra Dumps | ||
| Vendor: | WGU | Certification: | Courses and Certificates |
| Questions: | 142 Q&A's | Shared By: | lilly-rose |
The function P(t)represents the daily profit, in hundreds of dollars, for a hardware store since opening. The graph of P(t)is shown.
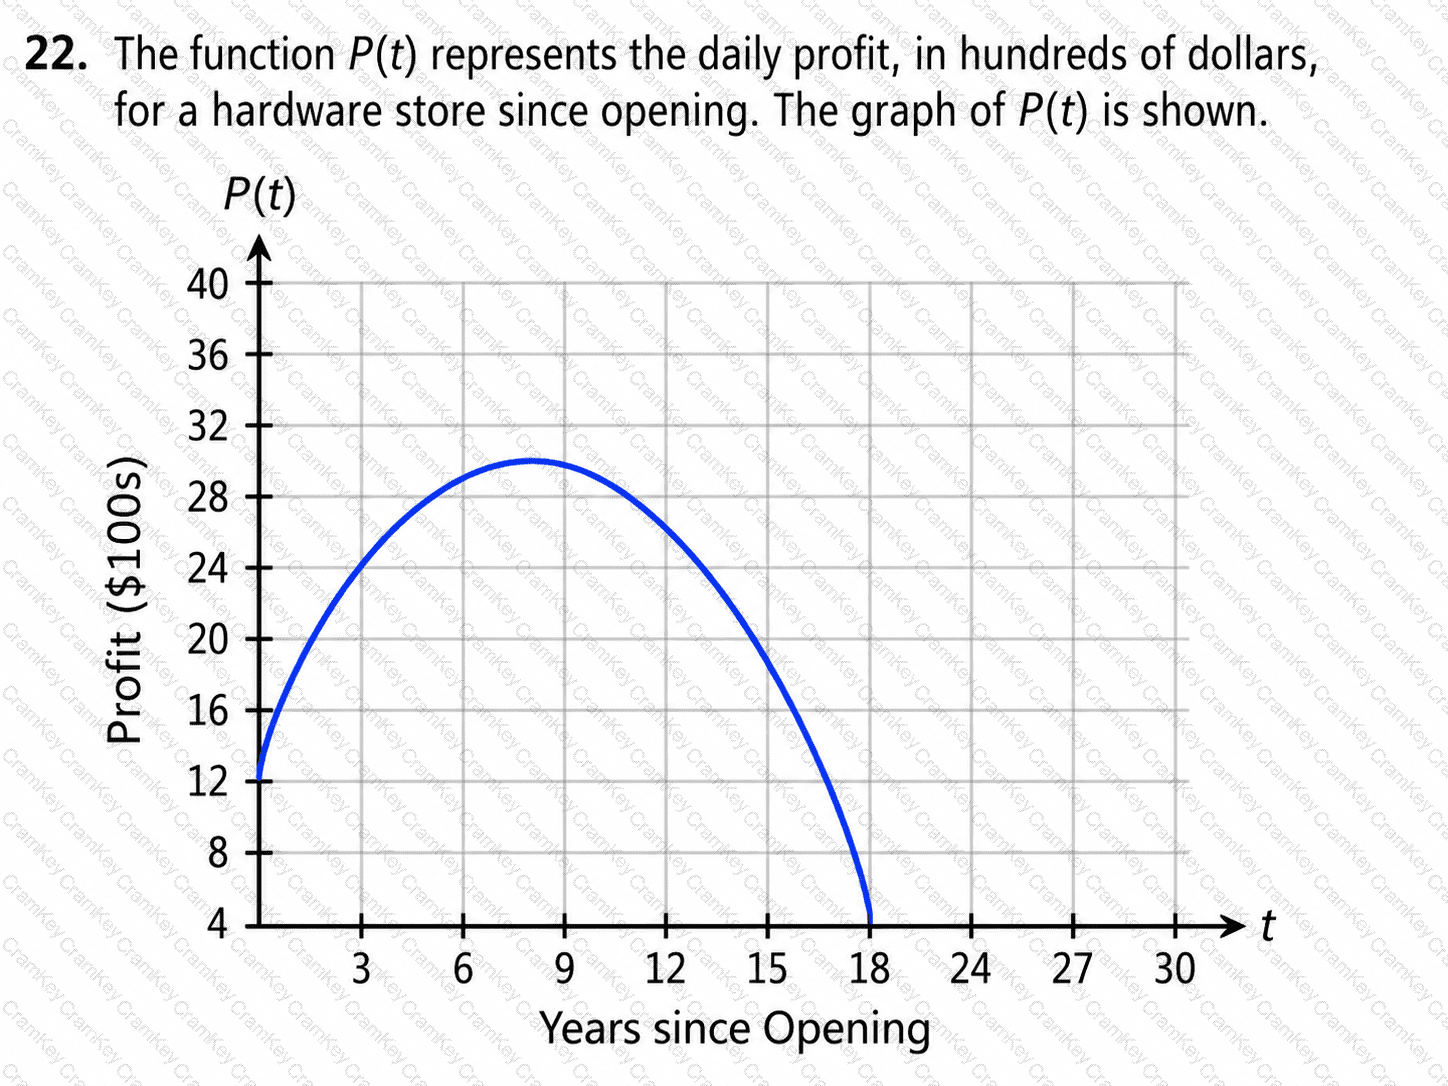
How should the maximum value be interpreted?
The number of employees under supervisor B is 13 more than the number of employees under supervisor A. Let F(n)represent the number of employees under the two supervisors, where nis the number of employees under supervisor A and Fis the number of employees under supervisor B.
Which is the correct function to represent this relationship?
The exponential function
f(x)=280× 〖 1.08 〗 ^x
represents the number of subscribers to a blog, where xrepresents the number of years since 2003 and f(x)represents the number of subscribers.
Which statement correctly interprets the average rate of change of the number of subscribers from 2003 to 2007? Round to the nearest whole number, if necessary.
The figure displays the graphs of two functions representing the heights, h_1and h_2, in feet, of two balls tseconds after being launched.
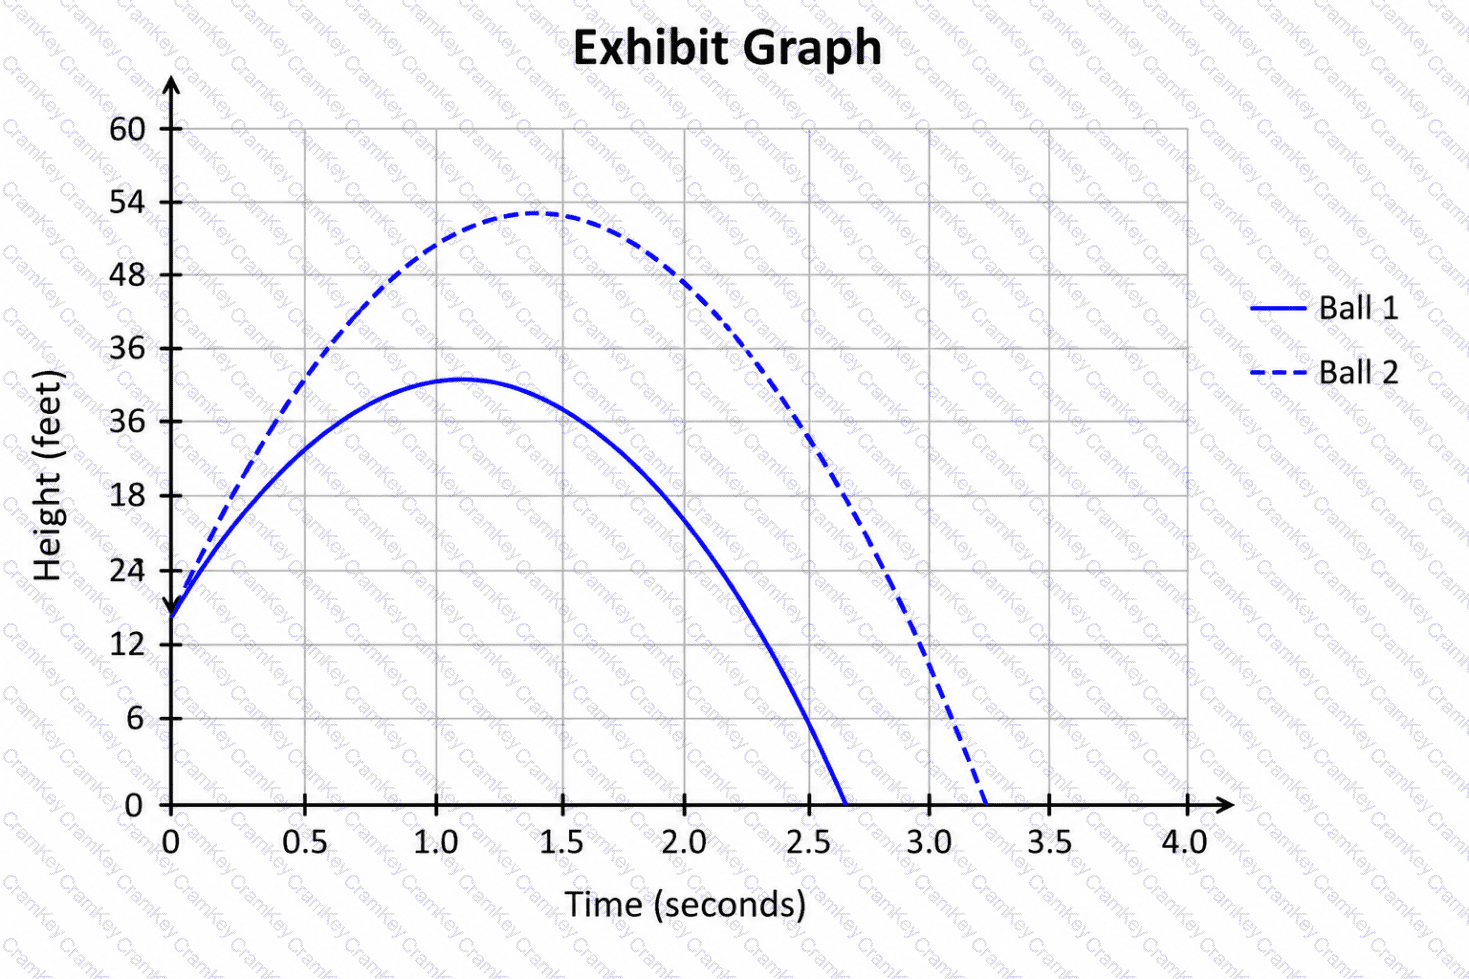
Which ball was lower 0.9seconds after being launched?

TESTED 13 Oct 2026