WGU Applied Algebra FXO2 PFXP C957
Last Update Oct 13, 2026
Total Questions : 142
To help you prepare for the Applied-Algebra WGU exam, we are offering free Applied-Algebra WGU exam questions. All you need to do is sign up, provide your details, and prepare with the free Applied-Algebra practice questions. Once you have done that, you will have access to the entire pool of WGU Applied Algebra FXO2 PFXP C957 Applied-Algebra test questions which will help you better prepare for the exam. Additionally, you can also find a range of WGU Applied Algebra FXO2 PFXP C957 resources online to help you better understand the topics covered on the exam, such as WGU Applied Algebra FXO2 PFXP C957 Applied-Algebra video tutorials, blogs, study guides, and more. Additionally, you can also practice with realistic WGU Applied-Algebra exam simulations and get feedback on your progress. Finally, you can also share your progress with friends and family and get encouragement and support from them.
The data in the scatterplot represents the number of monthly train crossings at a particular intersection over time.
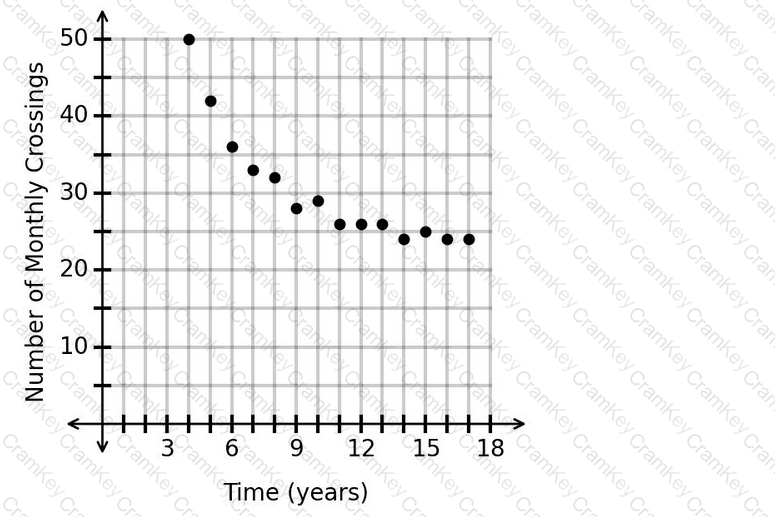
Which type of function should be used to model the data?
The function V(t)represents the number of travelers, V, in a travel depot thours after 7:00 a.m. The graph of V(t)is shown.
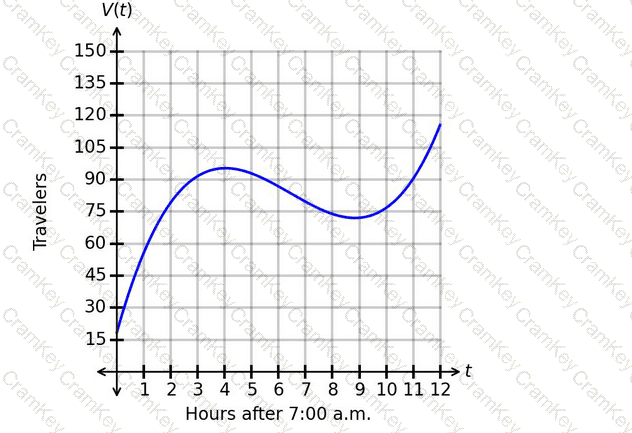
What does V(2)represent?
A factory mixes two colors, red and yellow, to create a dye.
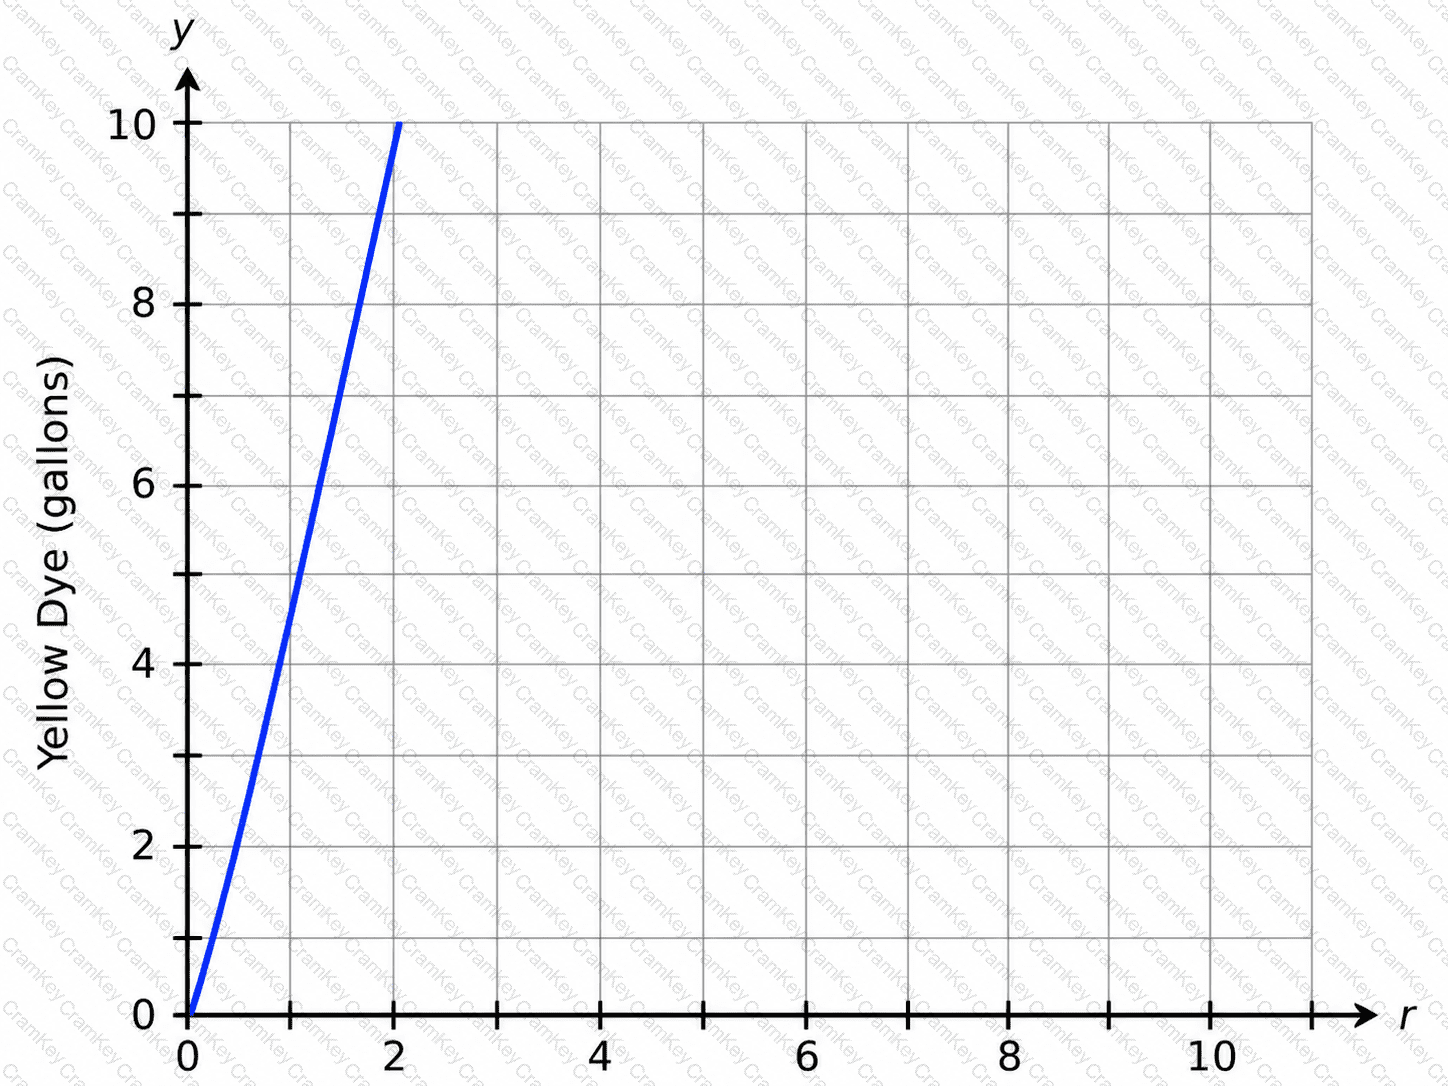
The graph shows the relationship between the amounts of each dye, where rrepresents the amount of red dye and yrepresents the amount of yellow dye.
What is the correct interpretation of the rate of change?
The function p(t)represents the number of active players, p, in a game thours after 11:00 a.m. The graph of p(t)is shown.
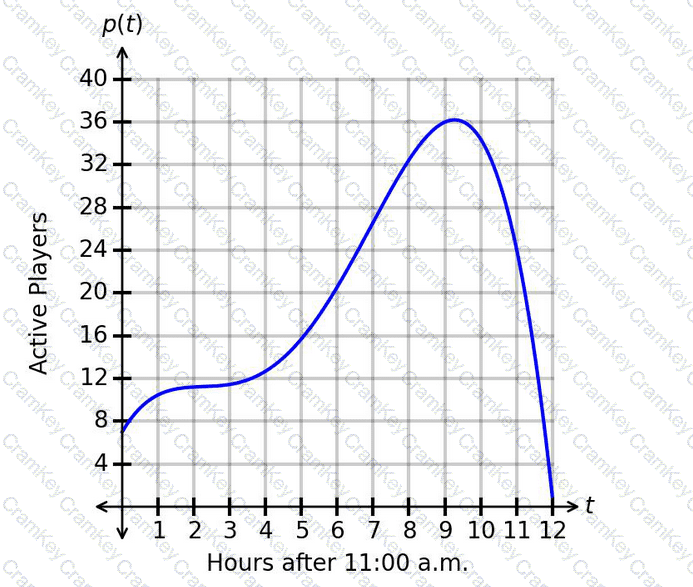
What is one example of an interval for which the number of players is decreasing faster and faster?

TESTED 13 Oct 2026