| Exam Name: | WGU Applied Algebra FXO2 PFXP C957 | ||
| Exam Code: | Applied-Algebra Dumps | ||
| Vendor: | WGU | Certification: | Courses and Certificates |
| Questions: | 142 Q&A's | Shared By: | kareem |
Consider the graph of x(t) shown. The function represents the number of users, x, watching a live video t hours after 9:00 a.m.
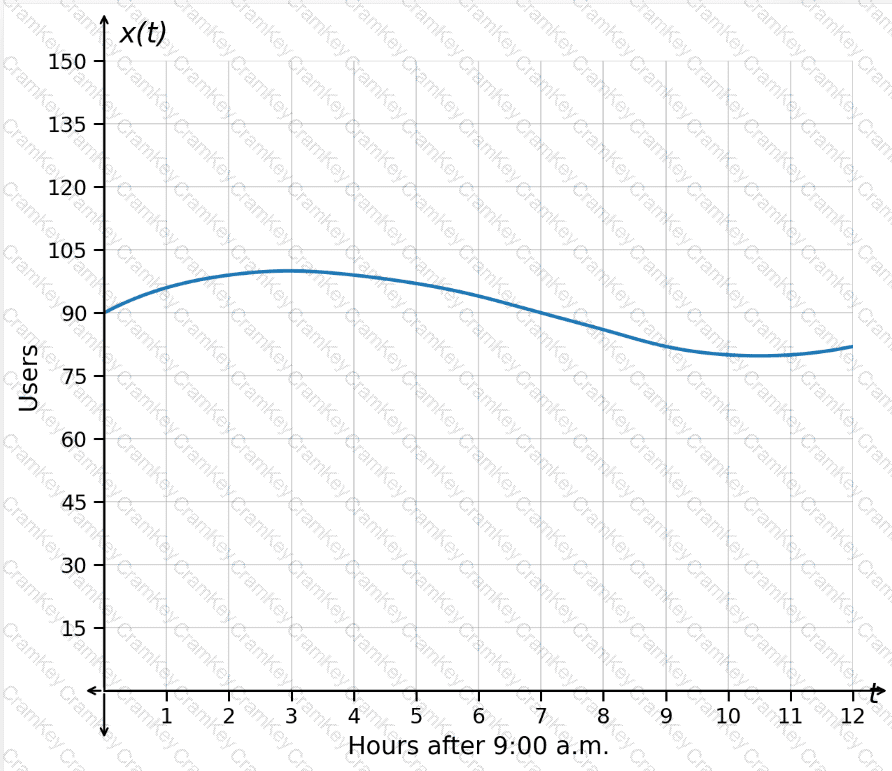
Which interval represents a range of values for which the number of users is decreasing slower and slower?
The graphed function v(t) represents the number of vehicles, v, stopped at a toll booth t hours after 6:00 a.m. The coordinates of points A and B are (1,49.4) and (4,45.8), respectively.
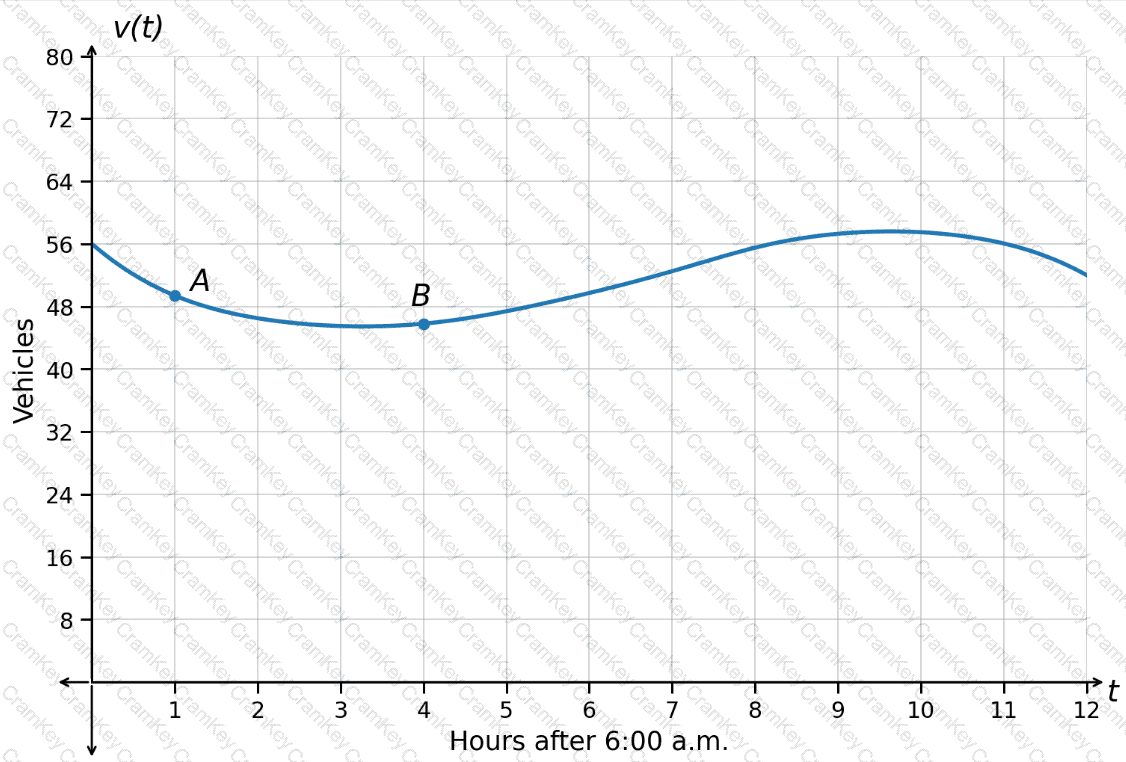
What is the average rate of change of the number of vehicles from point A to point B?
A researcher collected data on the number of annual bear sightings in a region over time. The results are shown in the scatterplot. The graphed regression function has an r
2
value of 0.41. The predicted number of annual bear sightings after 19.4 years is 88.5.
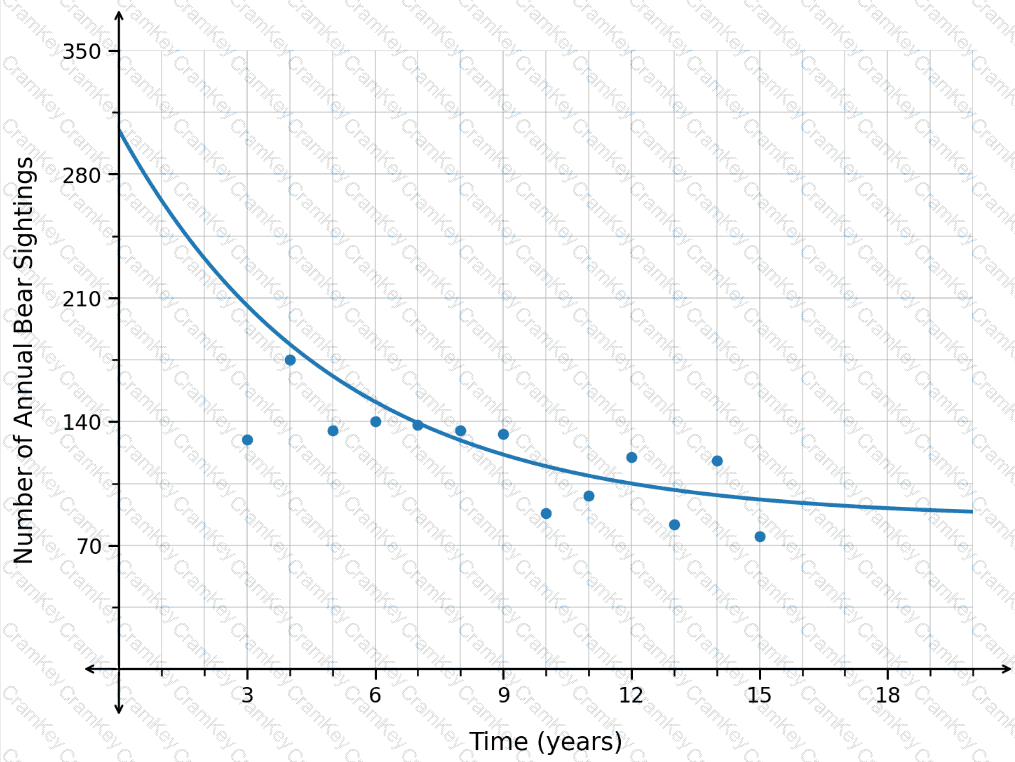
Is this prediction appropriate?
The function p(t)represents the number of active players, p, in a game thours after 11:00 a.m. The graph of p(t)is shown.
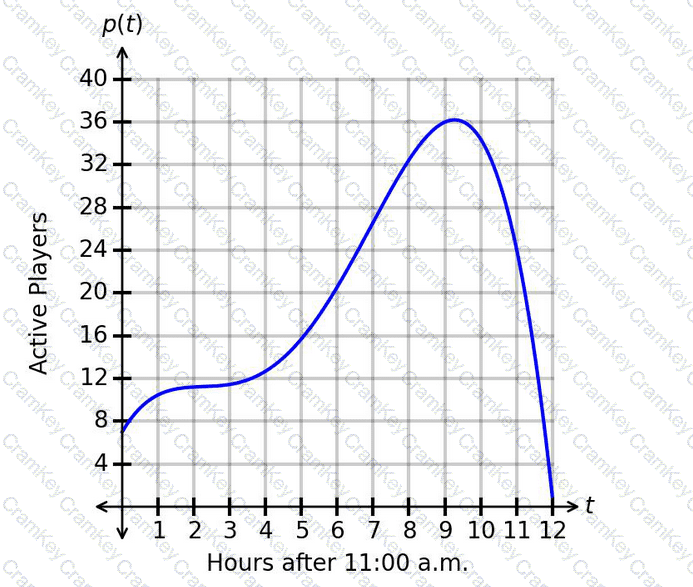
What is one example of an interval for which the number of players is decreasing faster and faster?

TESTED 13 Oct 2026